Soon after the UK’s Department for Culture, Media and Sport (DCMS) published the first definition of the creative industries in 1998, with 13 subsectors such as performing arts, film, advertising and software, it began to publish regular economic estimates of their value matching, wherever possible, the creative subsectors to the official Standard Industrial Classification (SIC) codes and Standard Occupational Classification (SOC) codes used by many countries in the construction of the national accounts.
This was widely regarded as having been successful in raising the economic profile of the creative industries, but the unsystematic nature of the DCMS’s methodology produced a number of problems too. Some of these were technical in nature but there were also deeper, conceptual, problems.
First, theoretical ambiguities around key terms such as ‘creativity’ and ‘intellectual property’ led to inevitable debates about why certain sectors were included, and others were not. Second, a reluctance on the part of the DCMS to publish separate economic statistics for the cultural industries contributed to the conflation of the concepts of ‘creative’ and ‘cultural’.
Third, and most fundamentally, the lack of a transparent process for identifying which industries and occupations should be classified as creative, and which should not, meant that the classifications lacked accuracy, for example missing out large numbers of freelancers working as designers in sectors not regarded as creative or in new and emerging industries such as videogames which were not captured by the SIC codes at all.
The lack of a transparent method for classifying creative industries and occupations held back the development of any international standard, resulting in different classifications being used in different countries.
To address this problem, Nesta (an independent charity that works to increase the innovation capacity of the UK through research and practical partnerships) developed a framework: the Dynamic Mapping. Creative roles were defined as those which deploy cognitive skills to bring about novelty whose final form cannot be fully specified in advance. In the original Dynamic Mapping report definitions were based on a subjective scoring of each standard occupation code in the UK workforce. In a more recent paper, Nesta used detailed data on job task descriptions and machine learning techniques to identify a wider range of occupations as creative. Nesta then calculated the percentage of the workforce in a creative occupation in every industry in the UK economy (in other words, its creative intensity) and analysed how this creative intensity was distributed across different sectors. This enabled them to identify as creative industries those with exceptionally high creative intensities, while a separate definition of employment in the creative economy added together those working in the creative industries and those working in creative jobs but in sectors outside of the creative industries.
What this methodology showed was that there were a small number of industries in the UK whose workforce included a very high proportion of people working in creative occupations, often 30% to 40% but in some cases 80% or even 90%, while the vast majority of other industries only had a creative intensity of around 3%. This suggests there is a strong statistical basis for considering creative subsectors with otherwise very different cultures, business and operating models as a coherent group for policy purposes.
In 2014 the DCMS adopted the main principles of the Dynamic Mapping framework and with this more transparent and robust methodology, the UK’s Office of National Statistics agreed to give what had previously been informal estimates of the country’s creative workforce, an official stamp of approval.
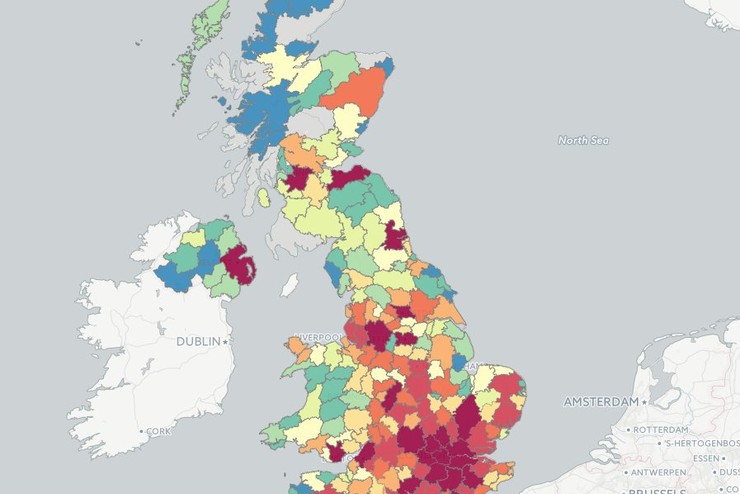
This, in turn, made it possible to get a much better understanding of the geography of the UK’s creative economy workforce and to do so on a basis consistent with how other parts of the economy were measured. So, for example, it was possible to show that in 2013, 43% of the UK’s creative economy workforce was employed in London and the South East of England compared with 32% of the high-tech economy workforce and just 28% of the workforce as a whole.
It was also possible to make more accurate international comparisons of the UK’s creative economy because of the use of SIC codes, and of labour force surveys of the type that are commonly undertaken in other countries.
Nesta subsequently published studies of the European and North American creative economies, using the creative intensity methodology, which suggests that it has the potential to be the basis of an international standard.
Another important feature of the Dynamic Mapping approach is that it recognises that sectors are fast changing. Specifically, the creative intensity of particular industries can vary over time, as they become more or less creative, depending on how technology and other structural changes lead them to alter their workforce compositions: the mapping is dynamic.
Measurement work of this kind sometimes invites the question: so what? But the brief history of the creative industries and the creative economy shows that robust and transparent ways of defining, classifying and measuring new and rapidly evolving sectors of the economy contributes to their being recognised and legitimised, not just by policymakers but also suppliers, educators and investors. In fact, it may turn out that the development of a rigorous mapping framework is one of the primary ways in which governments can support new industries, mapping as innovation policy.